Characteristics of the Advanced Telescopes
The Sun's atmosphere is comprised of layers. The layers beneath the surface (photosphere) cannot be seen directly, but the upper layers above the photosphere each emit different wavelengths of lights. So, you can see each layer by changing the observing wavelength. By loading three telescopes observing in different wavelength ranges, Hinode can simultaneously observe from the photosphere to the corona (upper atmosphere).

©NAOJ
Solar Optical Telescope
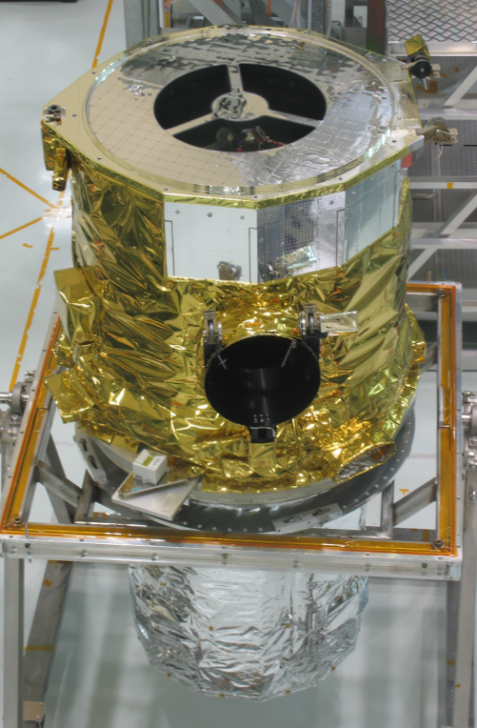
Solar Optical Telescope (SOT) (©NAOJ)
The Solar Optical Telescope (SOT) is an observational instrument that continuously observes the Sun with high spatial resolution in visible light.
With the SOT, by observing the Sun through a filter that transmits only light of a certain wavelength, we can diagnose the atmosphere that emits primarily that light. The figure on the left below is the image seen in the light emitted from the photosphere; the middle figure below is the image seen in the light emitted from the chromosphere. Also, by performing polarimetric observations of certain wavelengths, we can measure the magnetic field at the solar surface. (For details, please read the text in the box below.) The figure on the right shows the distribution of the solar surface magnetic field.
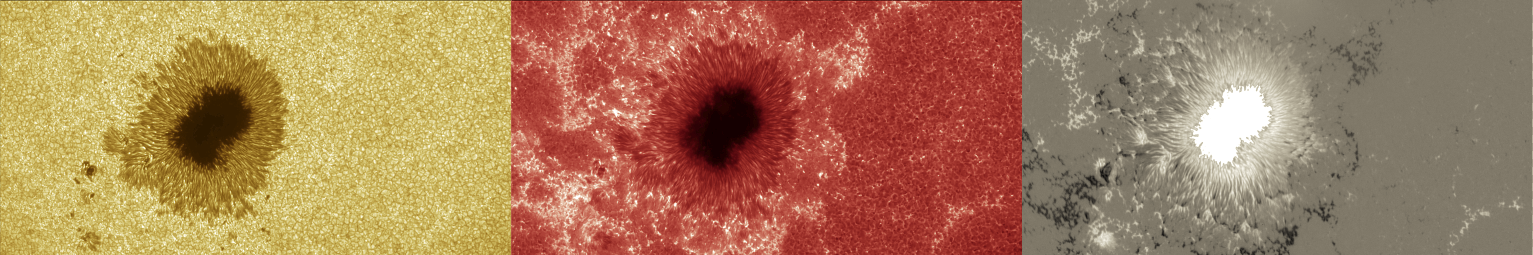
Three types of images taken by the Hinode SOT.
Images of the solar photosphere (left), solar chromosphere (middle), and solar magnetic field distribution (right) (©NAOJ/JAXA)
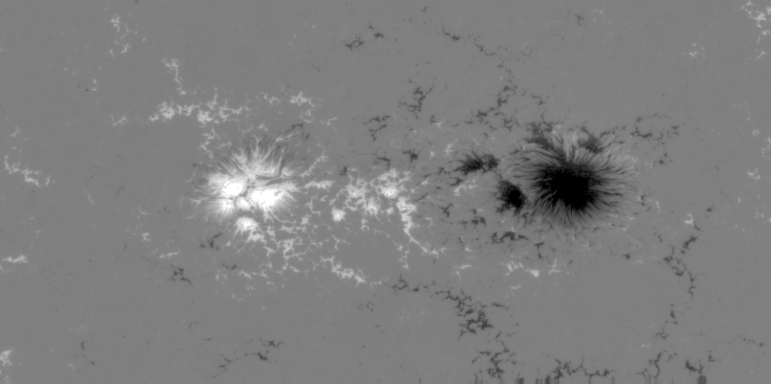
Through the magnetic distribution, you can distinguish local north and south magnetic polarities.
(The white area is a north polarity and the black area is a south polarity.) (©NAOJ / JAXA / HAO)
Measuring the Solar Magnetic Field through Polarimetric Observations
It is known that when there is a magnetic field, spectral lines which are sensitive to magnetic fields become polarized. Polarization describes the orientation of the wave vibrations in light waves. Polarization can be measured by using special optical devices similar to polaroid. Therefore, by measuring the polarization of spectral lines which are sensitive to magnetic fields, we can investigate the magnetic field at the place where the light was emitted.
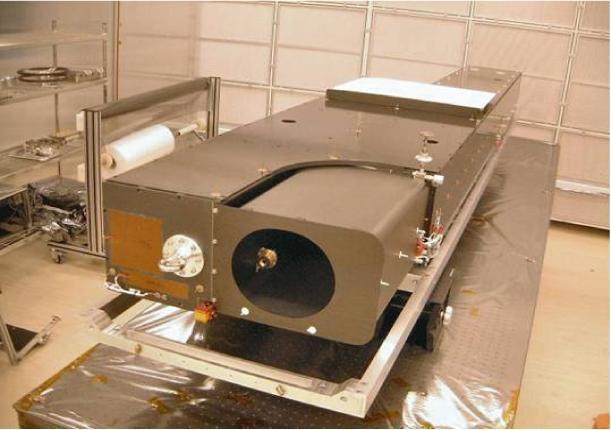
X-Ray Telescope
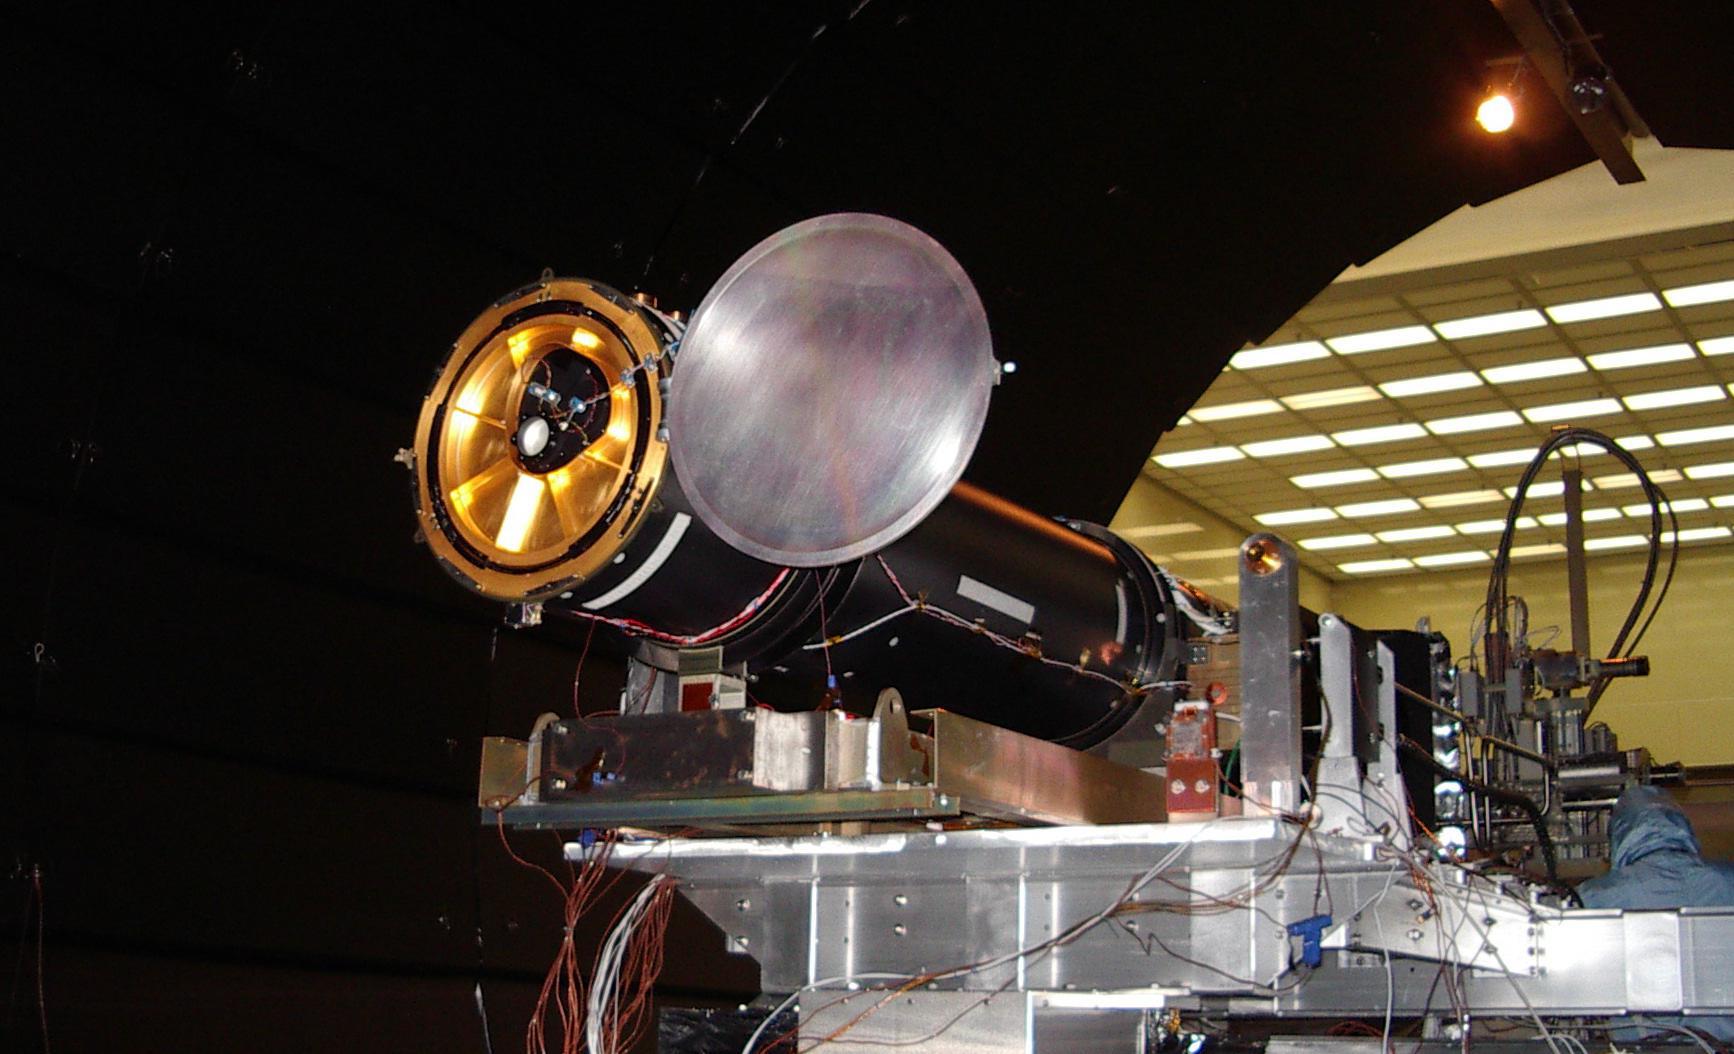
©NAOJ
The X-Ray Telescope (XRT) is an observational instrument that takes high spatial resolution images of the Sun in extreme-ultraviolet rays and X-rays. X-rays are emitted from the corona (upper atmosphere). Therefore, XRT can diagnose the corona. The image below is the full solar disk captured by XRT and a close up of the corona above a sunspot.
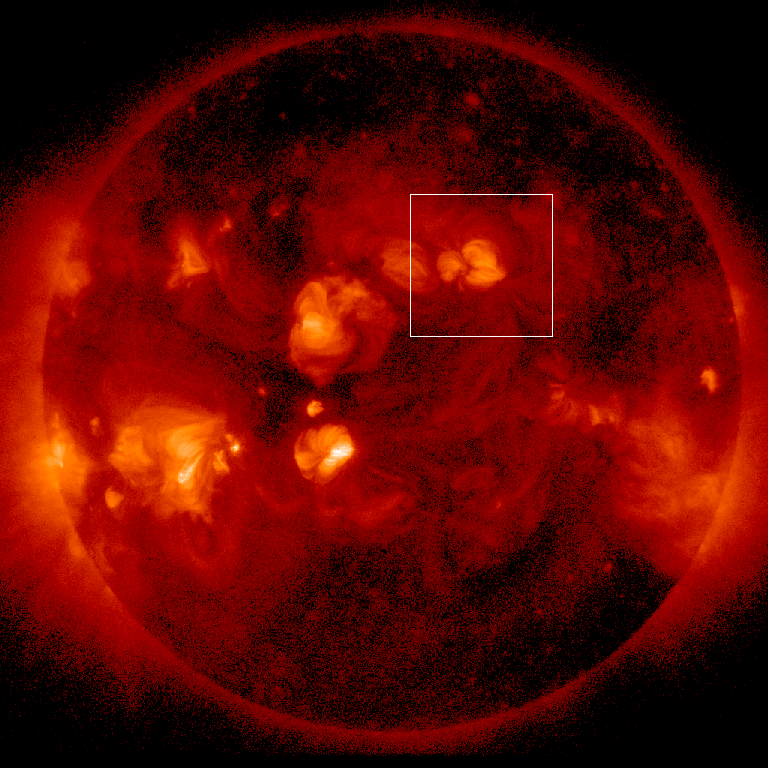
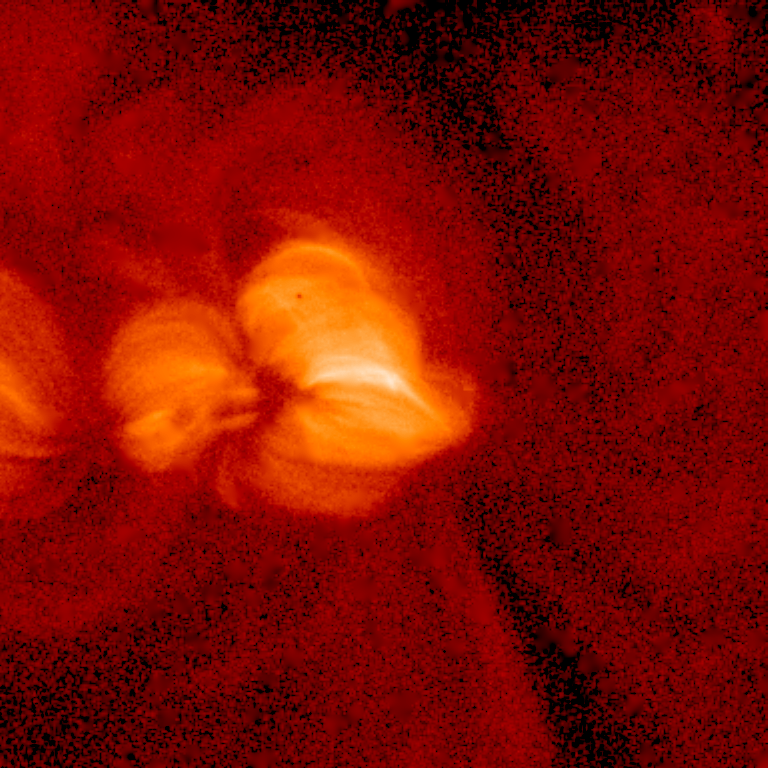
Full solar disk image taken by the Hinode XRT and a close up of the corona above the sunspot.
(©NAOJ / JAXA / Montana State University)
Extreme-ultraviolet Imaging Spectrometer
©NAOJ
The Extreme-ultraviolet Imaging Spectrometer (EIS) is a telescope capable of imaging spectroscopy in the extreme-ultraviolet region. Among ultraviolet rays, extreme-ultraviolet rays have the shortest wavelengths (i.e. the ultraviolet rays whose wavelengths are furthest from the visible light wavelengths). In this wavelength region, the emissions primarily from the transition region and corona can be observed.
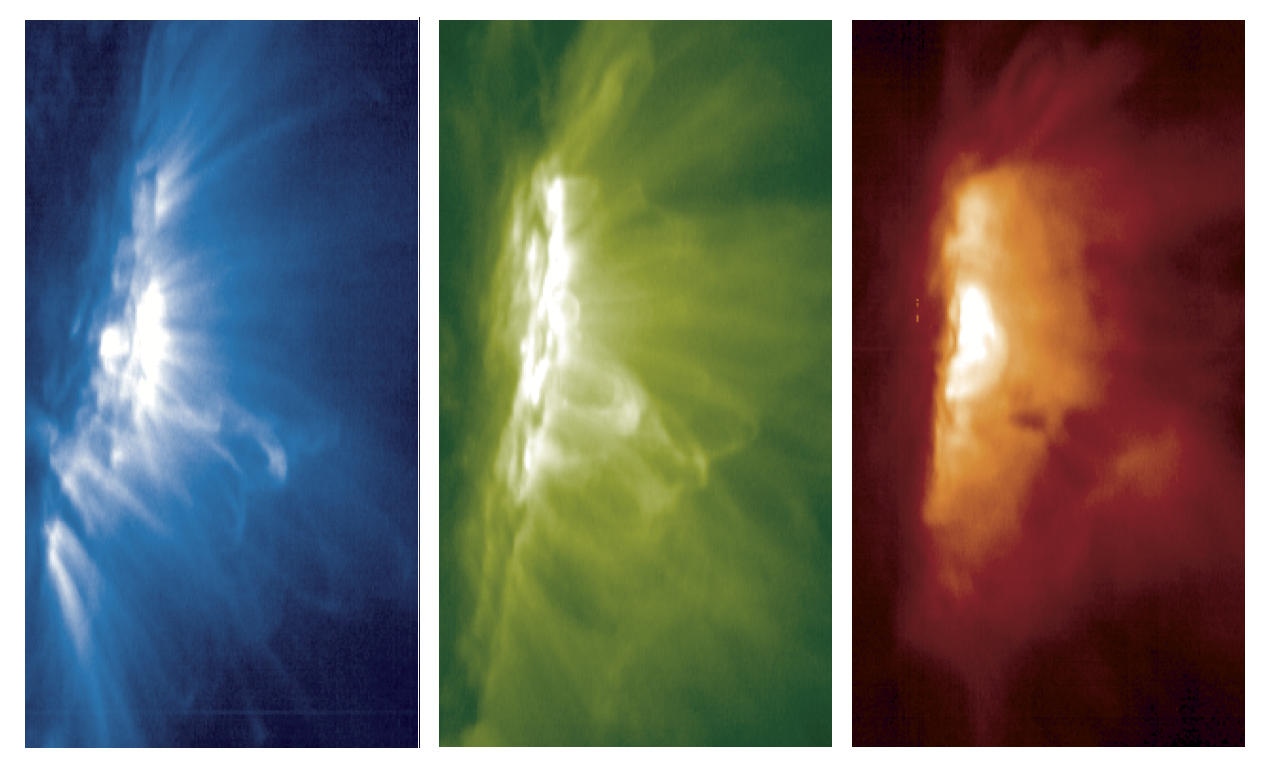
The transition region is a thin atmospheric layer which connects the chromosphere and corona. The temperature of the chromosphere is 10,000 K and the temperature of the corona is 1,000,000 K or more. So the transition region is the area where the temperature changes rapidly from 10,000 K to 1,000,000 K, connecting the chromosphere to the corona. With EIS, we can diagnose the atmosphere at various temperatures ranging from the transition region to the corona. (For details, please read the text in the box below.) These images below are an active region captured by EIS. They were taken with emission lines in the UV wavelengths originating from iron ions at various ionization stages. Moving from left to right, the images show atmosphere with increasing temperature. They show the coronal structures with temperatures of about 600,000 K, 1,400,000 K, and 3,000,000 K, respectively.
Looking at the Sun with Each Temperature
Let's use iron as an example; iron's atomic number is 26, in other words the element can have up to 26 electrons. In the high temperature corona, electrons are gradually lost and the element of iron exists as ferrous ions. As the temperature increases, so does the number of electrons removed. Even for atoms and ions of the same element, when the number of electrons is different, they emit spectral lines of different wavelengths. Therefore, if you observe all the spectral lines that ferrous ions emit at various temperatures, you can see the conditions in the solar atmosphere at each temperature at the same time.
Solar corona changes in its appearance depending on the wavelengths of ultraviolet rays.(©NAOJ / JAXA)
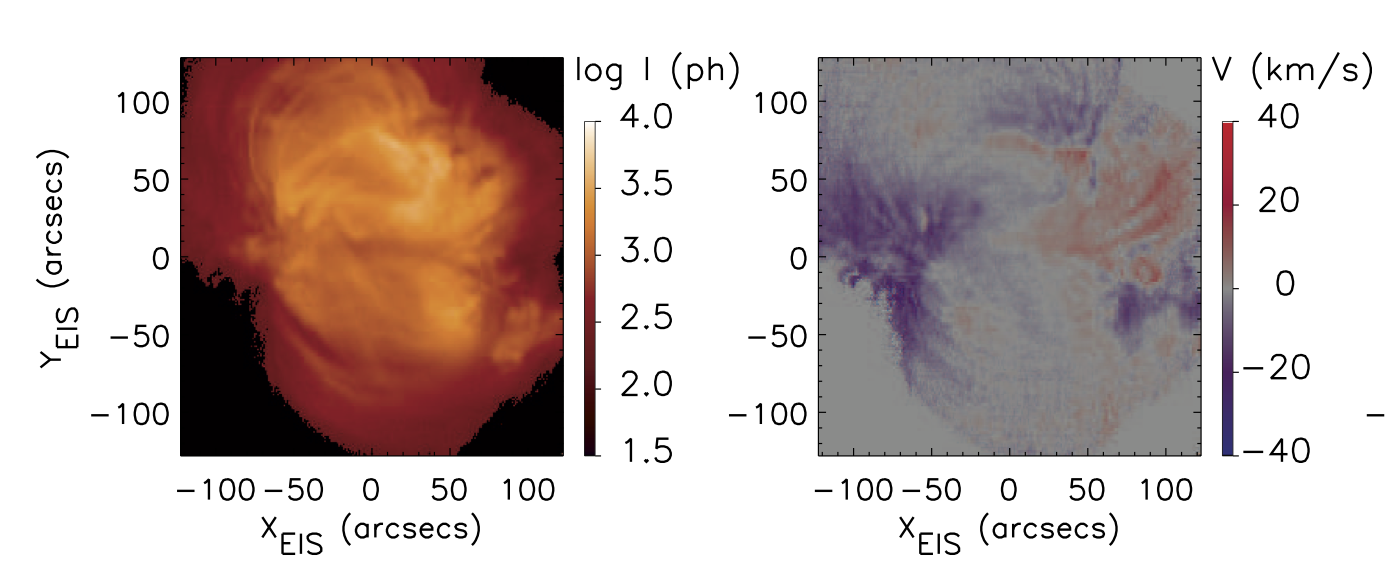
Also, with EIS, we can measure the plasma motion along the depth direction by performing spectroscopic observations. (For details, please read the text in the box below).
The left image shows an active region in the corona. The right image uses colors to show the speed of the plasma in the depth direction at each point. Receding motion from the viewer is shown in red, and approaching motion towards the viewer is shown in blue.
Determining the Velocity along the Depth Direction with Spectroscopic Observation
From imaging observations, transversal motions in the image plane can be detected, but we can't see the motions in the depth direction. How can we examine plasma motions in the depth direction? How can we determine if objects are getting closer to us or farther away from us? Please recall the sound of an ambulance siren. Sometimes, you can hear the sound of a speeding ambulance siren change pitch. This is because sound is a wave; the wavelength becomes shorter when the source making the noise is approaching, and the wavelength becomes longer when the source is moving away (this is called the Doppler effect). Light is also a wave, so in the same way, the wavelength becomes shorter when the object emitting the light is approaching, and the wavelength becomes longer when it is moving away. That means that if you know the original wavelength of the light, you can determine whether the light source is coming closer or moving away, depending on whether the observed wavelength is shorter or longer than the original wavelength. Therefore, when you observe the light wavelength via spectroscopy, you will know the velocity in the depth direction.
The observed image of the corona (left). We can determine the velocity by spectroscopic observation (right).
Receding plasma is shown in red and approaching plasma is shown in blue. (©NAOJ / JAXA)
Regarding the use of images and movies on the page concerned, please visit the page here. The credits of images and movies on this page are “NAOJ/JAXA” unless explicitly stated to the contrary. Regarding images and movies on this page the credits of which are “NAOJ/JAXA”, "NAOJ/JAXA/MSU", or “NAOJ, JAXA, NASA/MSFC”, terms of use for Copyrighted Works owned by NAOJ can be applied. In using the images and movies, the credits should be given.