Massive Flare on 13 December 2006
National Astronomincal Observatory of Japan (NAOJ)
Japan Aerospace Exploration Agency (JAXA)
National Aeronautics and Space Administration (NASA)
Particle Physics and Astronomy Research Council (PPARC)
Hinode (Solar-B) successfully captured a massive flare occurred in active region NOAA 10930 on 13 December 2006. It was one of the largest flares occurred in the period of solar activity minimum.
Data obtained with three telescopes on Hinode are in good quality. X-ray Telescope (XRT) saw high temperature coronal loop and detected wave propagation associated with the flare. Solar Optical Telescope (SOT) found the collision of two spots well in advance of the flare, which implies the twisting of magnetic fields in the corona. Extereme-ultraviolet Imaging Spectrometer (EIS) detected supersonic eruption during the flare.
This is the first time to get high resolution comprehensive data set ranging from magnetic fields, which are the energy source of the flare, and dynamics of high temperature plasma produced by the flare. Hinode team is now intensively studying the precious data.
This flare triggered a huge magnetic storm and aurora activity stretched to the border of Hokkaido, north island of Japan, where the aurora is rarely observed. Solar observation by Hinode will contribute to the space weather forecast.
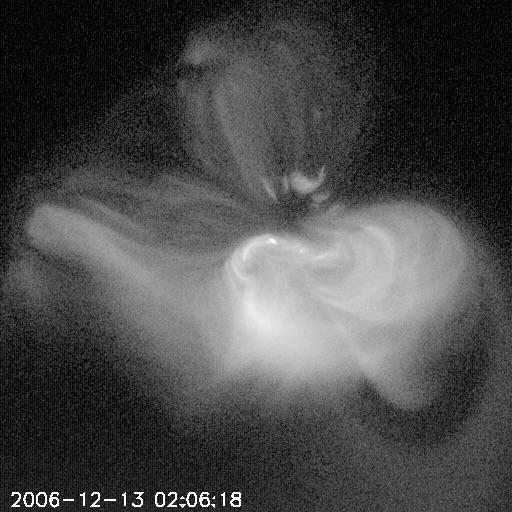
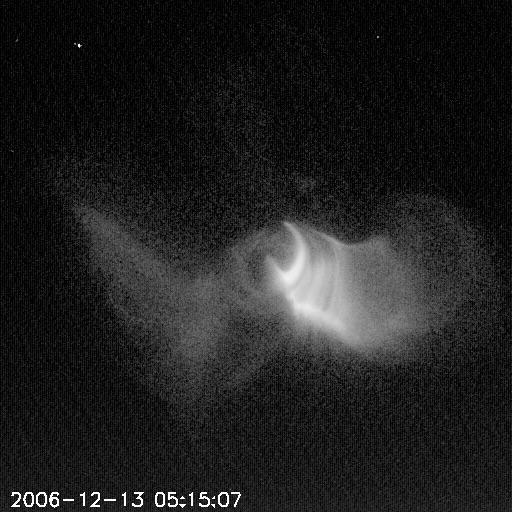
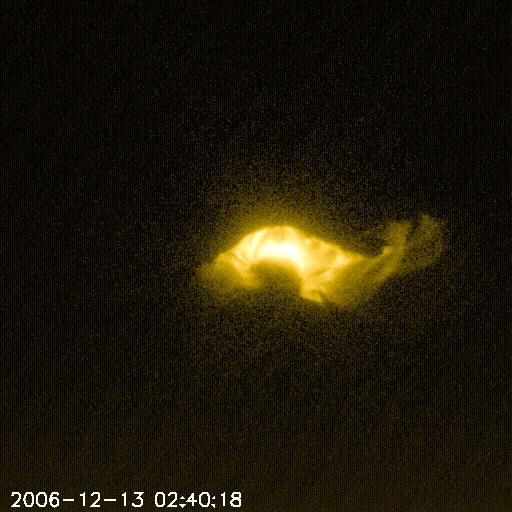
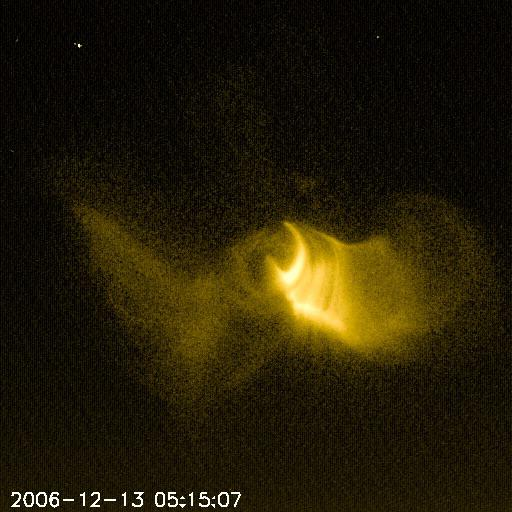
Sequence of XRT images shows the evolution of high temperature coronal loops. Strongly sheared loop structure had relaxed in the course of the flare. A cusp shape structure is found in the later phase, which implies occurrence of magnetic reconnection. The field of view is 512" by 512" corresponding to 3.7×105km by 3.7×105km on the Sun.
- XRT movie [Grayscale]
- XRT movie [Pseudo-color]
- XRT snapshots
Grayscale 
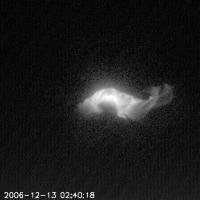
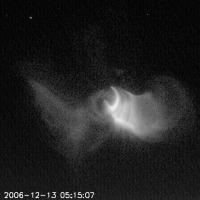
02:06:18 (before flare) 02:40:18 05:15:07 (after flare) Pseudo-color 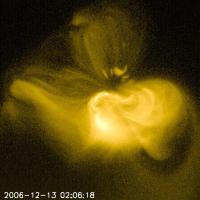
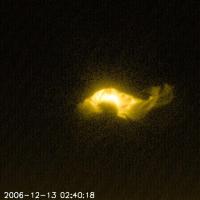

02:06:18 (before flare) 02:40:18 05:15:07 (after flare)


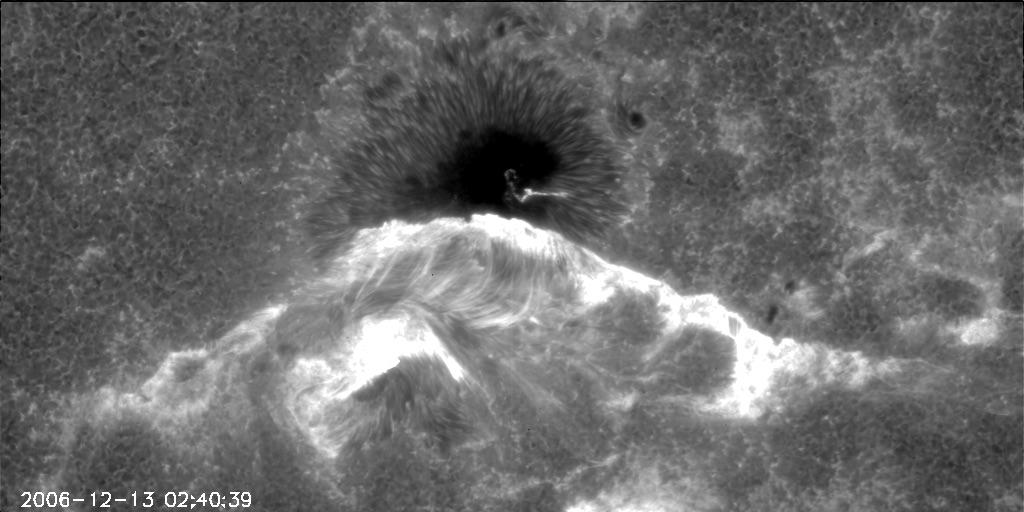
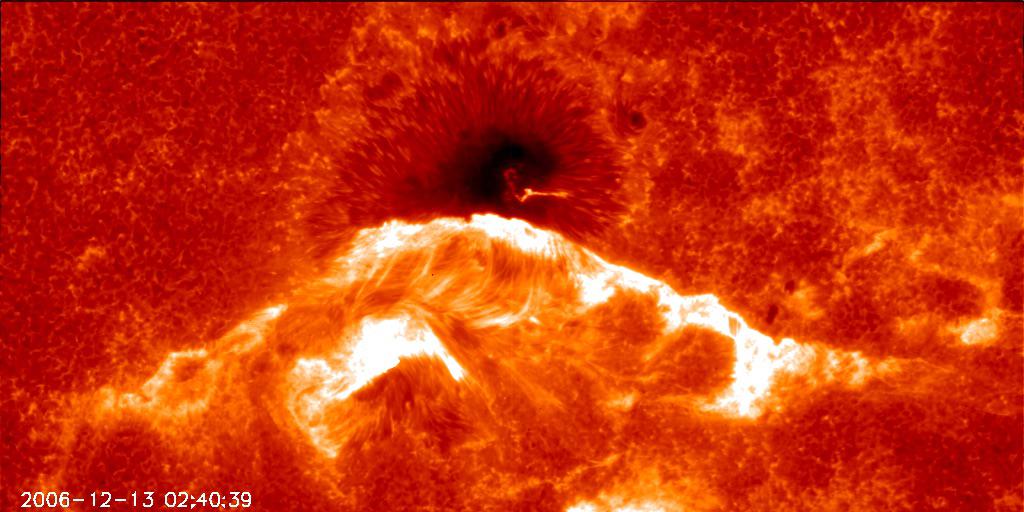
SOT images in Ca II H spectral line shows separating flare ribbon in the chromosphere. Fine structure of flare loops are also noticed. The field of view is 216" by 108" corresponding to 1.6×105km by 7.9×104km on the Sun.
- SOT movie in Ca II H line [Grayscale]
- SOT movie in Ca II H line [Pseudo-color]
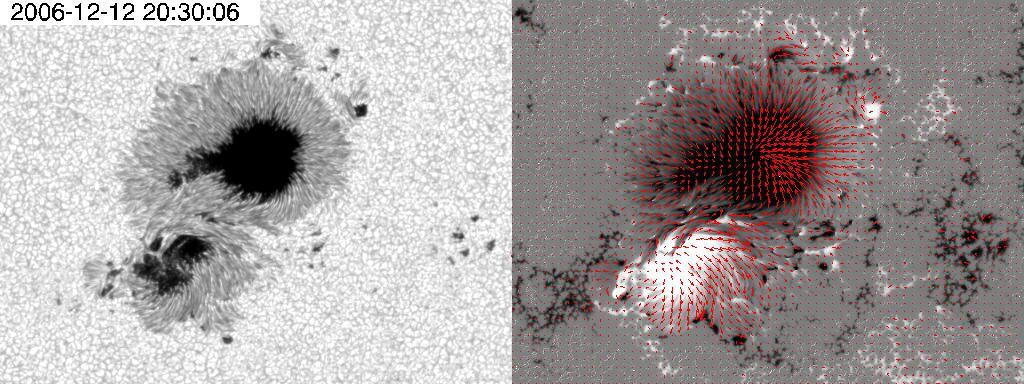
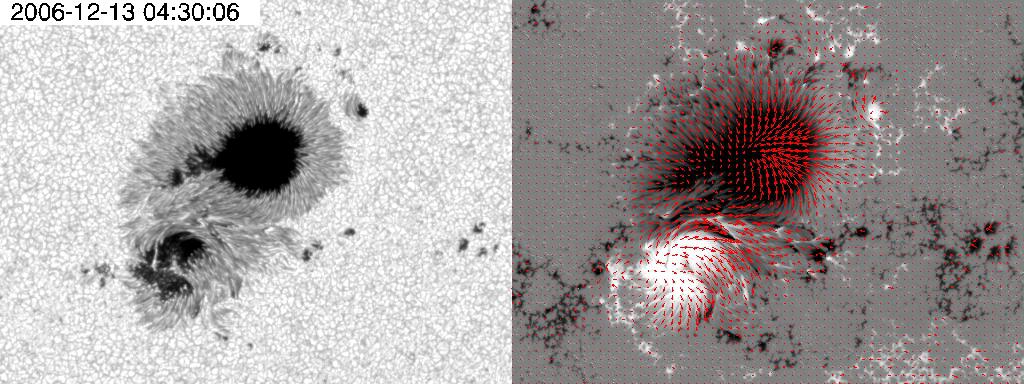
High resolution vector magnetogram processed from Spectro-Polarimeter of SOT. Colliding spots are clearly seen in the sequence of data. Left panel shows horizontal magnetic field vectors overlying G-band image, while right one indicates the same vectors overlying longitudinal magnetogram. Black and white correspond to S and N polarity.
- Magnetogram movie
Regarding the use of images and movies on the page concerned, please visit the page here. The credits of images and movies on this page are “NAOJ/JAXA” unless explicitly stated to the contrary. Regarding images and movies on this page the credits of which are “NAOJ/JAXA”, "NAOJ/JAXA/MSU", or “NAOJ, JAXA, NASA/MSFC”, terms of use for Copyrighted Works owned by NAOJ can be applied. In using the images and movies, the credits should be given.